
Previously, I had written a post on installing Suricata on Ubuntu and FreeBSD systems.
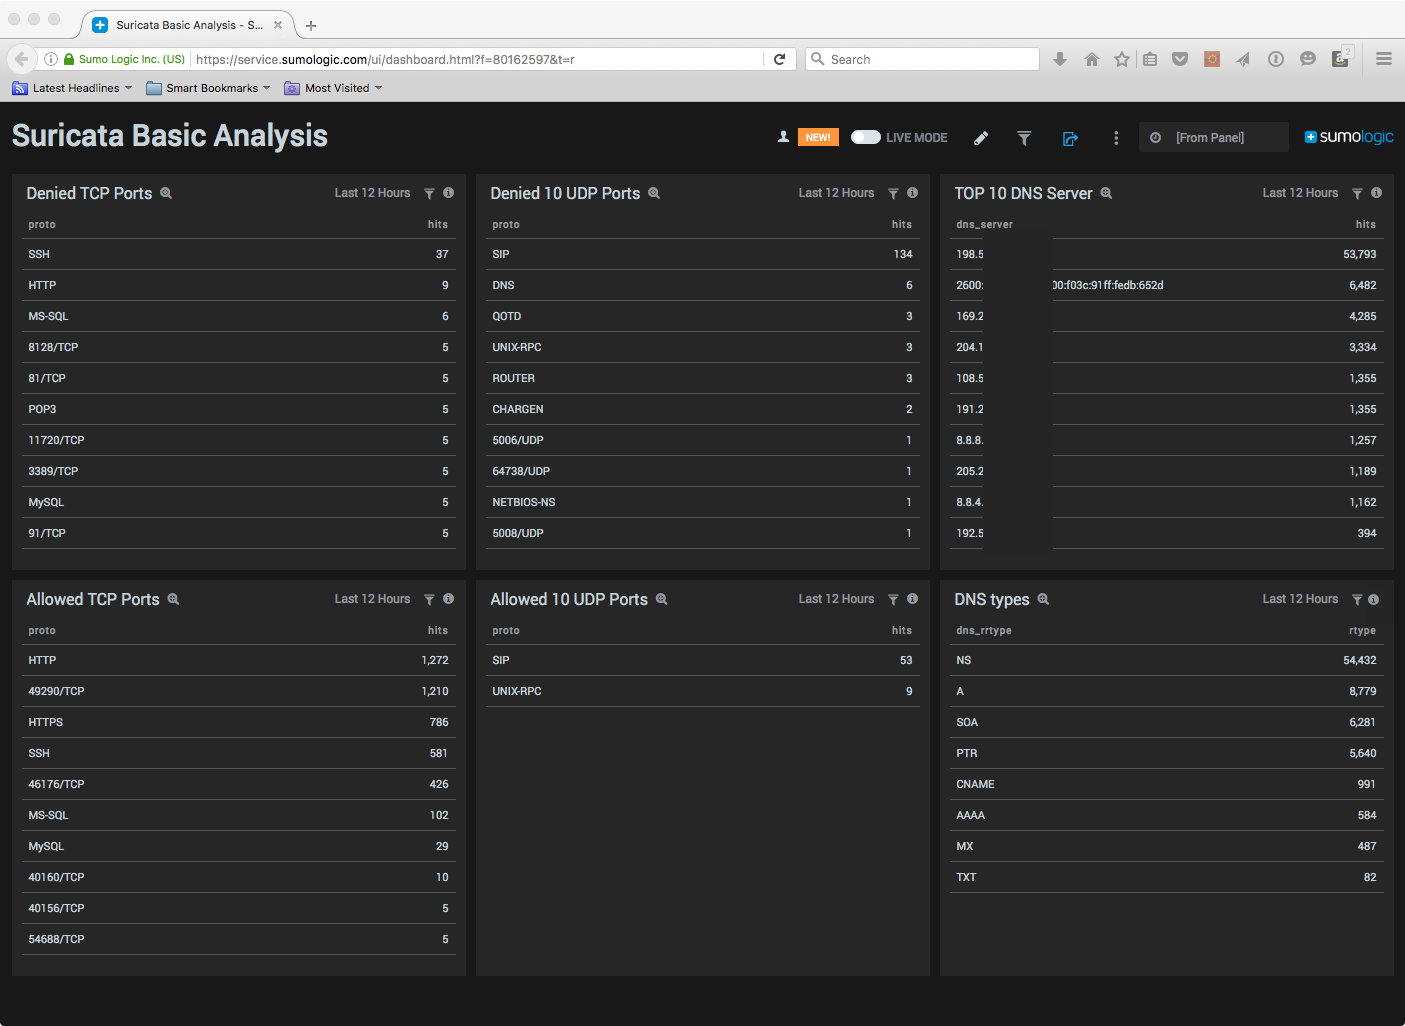
Now that I have collected data for a while I wanted to visualize what is happening within my hosts so I built some dashboards. This first one has allowed/denied ports and an overview of DNS queries by number->server and by type.
This dashboard is showing the output of 4 servers that I have Suricata running on and all are Internet facing. Two of them are behind a Fortigate firewall which is doing IDS/IPS already, 1 of them is behind GCP firewall, and the last one only has basic protections via iptables.
One of the things I did not do with this example is build a lookup table in Sumo Logic to simplify the search query. This would make the search query a lot smaller and, more than likely, faster. The linked text files will have the full query but for the examples in this post I will be replacing much of the query with ‘…’ to add brevity.
As I have done in the past, I have created a partition index specific to the data I am ingesting. I use this index as the base of my search query. (warning: too many partitions may slow down your queries and/or increase your data consumption within your account.)
As port numbers are simple integers I had to use the concat function to change the port/protocol to something that could be matched explicitly. I prepended a space so that 22/TCP and 4122/TCP didn’t turn into SSH and 41SSH/TCP.
concat (" ", port, "/", protocol) as proto
Suricata logs in JSON format so these queries use the JSON parser within Sumo Logic.
{
    "timestamp":"2016-05-11T14:28:49.906548+0000",
    "flow_id":3855599639,
    "in_iface":"eth0",
    "event_type":"alert",
    "src_ip":"124.205.250.19",
    "src_port":7959,
    "dest_ip":"xxx.xxx.xxx.xxx",
    "dest_port":22,
    "proto":"TCP",
    "alert":
    {
        "action":"blocked",
        "gid":1,
        "signature_id":2500012,
        "rev":3964,
        "signature":"ET COMPROMISED Known Compromised or Hostile Host Traffic group 7",
        "category":"Misc Attack",
        "severity":2
    }
}
Top 10 denied TCP ports: download query
_index=suricata_logs AND "\"event_type\":\"alert\"" AND "\"action\":\"blocked\""
  | parse "*" as jsonobject nodrop
  | json field=jsonobject "src_ip","dest_ip","dest_port","proto" as source, destination, port, protocol
  | where protocol = "TCP"
  | concat (" ", port, "/", protocol) as proto
  | replace (proto, " 110/TCP", "POP3") as proto
...
  | replace (proto, " 995/TCP", "IMAPS") as proto
  | replace (proto, " ", "") as proto
  | count as hits proto //source, destination, proto
  | order by hits
  | limit 10
Top 10 allowed TCP ports: download query
_index=suricata_logs AND "\"event_type\":\"alert\"" AND "\"action\":\"allowed\""
  | parse "*" as jsonobject nodrop
  | json field=jsonobject "src_ip","dest_ip","dest_port","proto" as source, destination, port, protocol
  | where protocol = "TCP"
  | concat (" ", port, "/", protocol) as proto
  | replace (proto, " 110/TCP", "POP3") as proto
...
  | replace (proto, " 995/TCP", "IMAPS") as proto
  | replace (proto, " ", "") as proto
  | count as hits proto //source, destination, proto
  | order by hits
  | limit 10
Top 10 denied UDP ports: download query
_index=suricata_logs AND "\"event_type\":\"alert\"" AND "\"action\":\"blocked\""
  | parse "*" as jsonobject nodrop
  | json field=jsonobject "src_ip","dest_ip","dest_port","proto" as source, destination, port, protocol
  | where protocol = "UDP"
  | concat (" ", port, "/", protocol) as proto
  | replace (proto, " 110/TCP", "POP3") as proto
...
  | replace (proto, " 995/TCP", "IMAPS") as proto
  | replace (proto, " ", "") as proto
  | count as hits proto //source, destination, proto
  | order by hits
  | limit 10
Top 10 allowed UDP ports: download query
_index=suricata_logs AND "\"event_type\":\"alert\"" AND "\"action\":\"allowed\""
  | parse "*" as jsonobject nodrop
  | json field=jsonobject "src_ip","dest_ip","dest_port","proto" as source, destination, port, protocol
  | where protocol = "UDP"
  | concat (" ", port, "/", protocol) as proto
  | replace (proto, " 110/TCP", "POP3") as proto
...
  | replace (proto, " 995/TCP", "IMAPS") as proto
  | replace (proto, " ", "") as proto
  | count as hits proto //source, destination, proto
  | order by hits
  | limit 10
The JSON for the DNS logging is slightly different. There is a ‘dns’ JSON tag with further breakdown that requires extraction.
{

    "timestamp":"2016-05-11T15:56:28.932081+0000",
    "flow_id":3157875878,
    "in_iface":"eth0",
    "event_type":"dns",
    "src_ip":"xxx.xxx.xxx.xxx",
    "src_port":53,
    "dest_ip":"130.207.54.136",
    "dest_port":43835,
    "proto":"UDP",
    "dns":?
    {
        "type":"answer",
        "id":22354,
        "rcode":"NOERROR",
        "rrname":"geekandi.com",
        "rrtype":"SOA",
        "ttl":20864
    }

}
Top 10 DNS servers (no download needed):
_index=suricata_logs "\"event_type\":\"dns\""
  | parse "*" as jsonobject nodrop
  | json field=jsonobject "src_ip", "dns.type" as dns_server, dns_type
  | where dns_type = "answer"
  | count as hits dns_server
  | order by hits
  | limit 10
For this next one I am extracting some extra data that I did not use in the dashboard panel. I did this so that I can come back later and use the same basic query and create another panel to look at the top records retrieved from my name-servers. Go ahead and see what you can do!
Top 10 DNS types (no download needed):
_index=suricata_logs "\"event_type\":\"dns\""
  | parse "*" as jsonobject nodrop
  | json field=jsonobject "src_ip", "dns.rrname", "dns.rcode", "dns.rrtype" as src_ip, dns_rrname, dns_rcode, dns_rrtype
  | count as rtype dns_rrtype
  | order by rtype
  | limit 10