If you are starting to use Sumo Logic then you know that you pay for your volume of data ingested into their platform. They have a quick graphic to show you how much you have used over the running 30 days (you will need to be logged in) and this is helpful.
But if you are not careful you could end up with thousands of dollars of overage fees.
But how do you know which categories are using your allotted storage? The earlier link only shows you total ingested data per day and does not include a breakdown needed to really look into how you are doing your logging.
Hence the reason for this post!
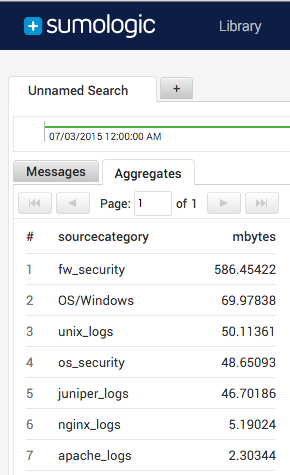
First example is to show you in terms of MiB while the second will show you in GiB.
_index=sumologic_volume _sourceCategory=sourcecategory_volume
  | parse regex "\"(?<sourcecategory>[^\"]+?)\"\:\{\"sizeInBytes\"\:(?<bytes>\d+),\"count\"\:(?<count>\d+)\}" multi
  | bytes/1024/1024 as mbytes
  | sum(mbytes) as mbytes by sourcecategory
  | order by mbytes
_index=sumologic_volume _sourceCategory=sourcecategory_volume
  | parse regex "\"(?<sourcecategory>[^\"]+?)\"\:\{\"sizeInBytes\"\:(?<bytes>\d+),\"count\"\:(?<count>\d+)\}" multi
  | bytes/1024/1024/1024 as gbytes
  | sum(gbytes) as gbytes by sourcecategory
  | order by gbytes
You can make a panel for this in one of your dashboards to show you running usage (I’d use the 24 hour search output for this) or set up a scheduled search to email you daily. This would allow you to report back ‘yesterday’s usage each day so you can make adjustments, if needed. Once you have the saved search you could also set up an alert to look for abnormal log ingestion rates.
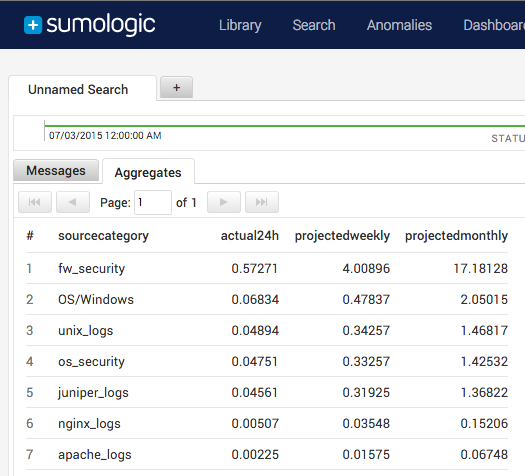
At my day job one of the other engineers set up a dashboard panel starting with the example above to predict our usage using a search for the last 24 hours, and looks like this:
_index=sumologic_volume _sourceCategory=sourcecategory_volume
  | parse regex "\"(?<sourcecategory>[^\"]+?)\"\:\{\"sizeInBytes\"\:(?<bytes>\d+),\"count\"\:(?<count>\d+)\}" multi
  | bytes/1024/1024/1024 as gbytes
  | sum(gbytes) as actual24h by sourcecategory
  | actual24h*7 as projectedweekly
  | actual24h*30 as projectedmonthly
  | sort by actual24h
Of course your log volume does fluctuate so the predicted weekly and monthly volume numbers are going to move each day especially if your log volume during the week is variable.