
Let’s say you are not using a SNMP monitoring system for performance gathering from your Fortigate firewall, but you are collecting logs via Sumo Logic.
Did you know that the Fortigate emits events specific to performance metrics for further analysis?
Me either. Until earlier today.
Assumptions for this sample dashboard
- I have a partition named security_logs for indexing
- I have a class named fw_security as my category
Adjust the timeslice value as needed:
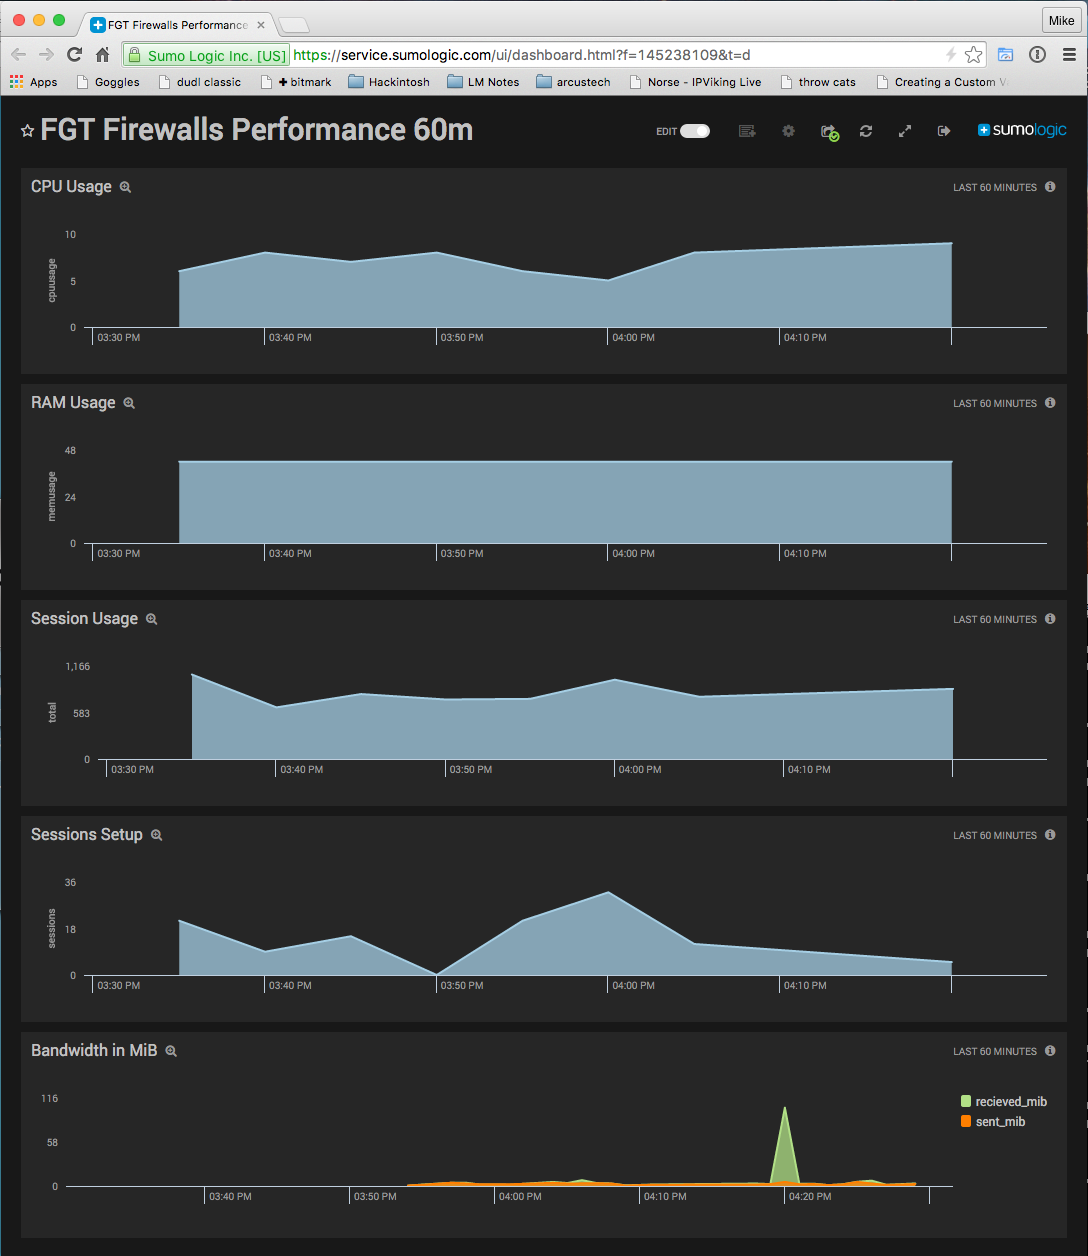
- 1m or 5m works great for 1-12 hours graphs – screenshot in this post is a 1 hour graph
- 30m works great for 24 hours or longer graphs
To graph CPU usage:
_index=security_logs _sourceCategory=fw_security ("type=\"event\"" AND "action=\"perf-stats\"")
| extract " cpu=(?<cpu>.*?) mem=(?<mem>.*?) totalsession=(?<sessions>.*?) disk=(?<disk>.*) bandwidth=(?<left>.*)/(?<right>.*?) setuprate=(?<sps>.*?) "
| timeslice 5m
| avg(cpu) as cpuusage by _timeslice
| sort by _timeslice asc
To graph RAM usage:
_index=security_logs _sourceCategory=fw_security ("type=\"event\"" AND "action=\"perf-stats\"")
| extract " cpu=(?<cpu>.*?) mem=(?<mem>.*?) totalsession=(?<sessions>.*?) disk=(?<disk>.*) bandwidth=(?<left>.*)/(?<right>.*?) setuprate=(?<sps>.*?) "
| timeslice 5m
| avg(mem) as memusage by _timeslice
| sort by _timeslice asc
To graph concurrent sessions usage:
_index=security_logs _sourceCategory=fw_security ("type=\"event\"" AND "action=\"perf-stats\"")
| extract " cpu=(?<cpu>.*?) mem=(?<mem>.*?) totalsession=(?<sessions>.*?) disk=(?<disk>.*) bandwidth=(?<left>.*)/(?<right>.*?) setuprate=(?<sps>.*?) "
| timeslice 5m
| avg(sessions) as total by _timeslice
| sort by _timeslice asc
To graph session setup usage:
_index=security_logs _sourceCategory=fw_security ("type=\"event\"" AND "action=\"perf-stats\"")
| extract " cpu=(?<cpu>.*?) mem=(?<mem>.*?) totalsession=(?<sessions>.*?) disk=(?<disk>.*) bandwidth=(?<left>.*)/(?<right>.*?) setuprate=(?<sps>.*?) "
| timeslice 5m
| avg(sps) as sessions by _timeslice
| sort by _timeslice asc
To graph bandwidth usage:
_index=security_logs _sourcecategory=fw_security "type=\"traffic\"" // includes action=close and action=timeout
| parse "sentbyte=* " as bsnt
| parse "rcvdbyte=* " as brec
| brec+bsnt as bTot // total bytes transferred
| timeslice 1m
| sum(brec) as recvbytes, sum(bsnt) as sentbytes by _timeslice
| (recvbytes/1000000) as recieved_mib
| (sentbytes/1000000) as sent_mib
| fields - recvbytes, sentbytes